Grundlæggende statistik
| Institutionelle ejere | 125 total, 124 long only, 0 short only, 1 long/short - change of 13,51% MRQ |
| Gennemsnitlig porteføljeallokering | 0.0661 % - change of -24,70% MRQ |
| Institutionelle aktier (lange) | 3.510.102 (ex 13D/G) - change of 0,09MM shares 2,52% MRQ |
| Institutionel værdi (lang) | $ 190.498 USD ($1000) |
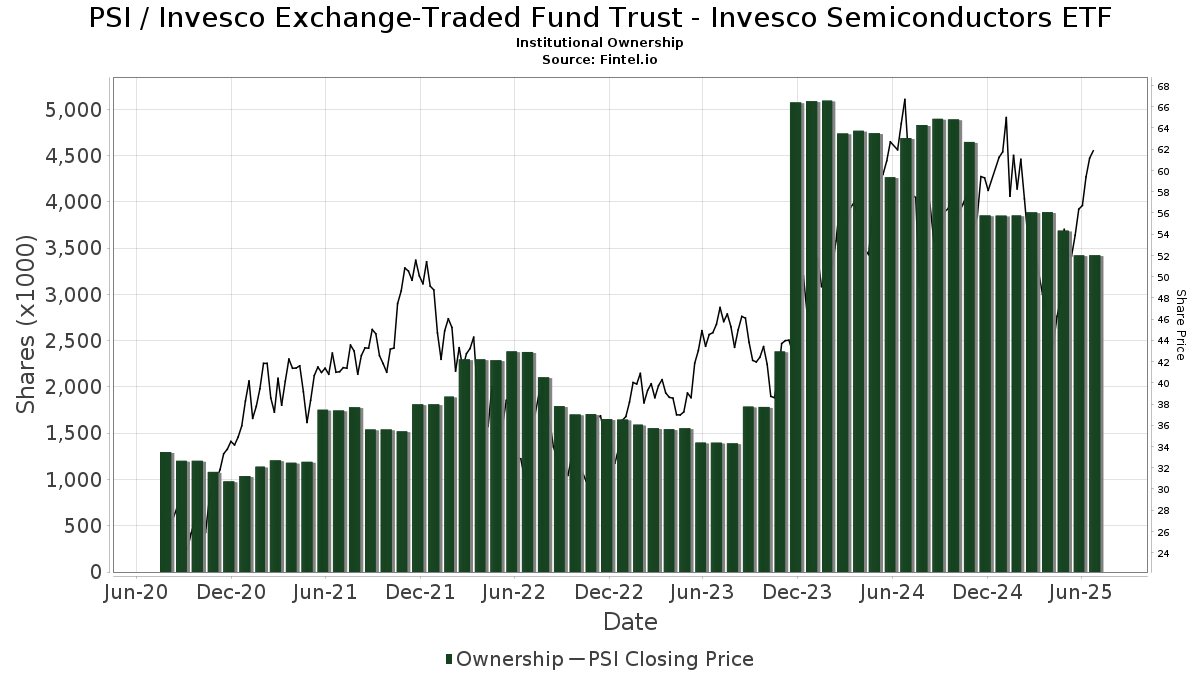
Institutionelt ejerskab og aktionærer
Invesco Exchange-Traded Fund Trust - Invesco Semiconductors ETF (US:PSI) har 125 institutionelle ejere og aktionærer, der har indsendt 13D/G- eller 13F-formularer til Securities Exchange Commission (SEC). Disse institutioner har i alt 3,510,102 aktier. Største aktionærer omfatter LPL Financial LLC, Morgan Stanley, Captrust Financial Advisors, Cetera Investment Advisers, Bank Of America Corp /de/, HighTower Advisors, LLC, Ameriprise Financial Inc, Envestnet Asset Management Inc, UBS Group AG, and Mercer Global Advisors Inc /adv .
Invesco Exchange-Traded Fund Trust - Invesco Semiconductors ETF (ARCA:PSI) institutionel ejerskabsstruktur viser aktuelle positioner i virksomheden efter institutioner og fonde, samt seneste ændringer i positionsstørrelse. Større aktionærer kan omfatte individuelle investorer, investeringsforeninger, hedgefonde eller institutioner. Skema 13D angiver, at investoren besidder (eller besidder) mere end 5 % af virksomheden og har til hensigt (eller har til hensigt at) aktivt at forfølge en ændring i forretningsstrategi. Skema 13G indikerer en passiv investering på over 5%.
The share price as of September 16, 2025 is 68,29 / share. Previously, on September 17, 2024, the share price was 53,85 / share. This represents an increase of 26,82% over that period.
Fondens stemningsscore
Fund Sentiment Score (fka Ownership Accumulation Score) finder de aktier, der bliver mest købt af fonde. Det er resultatet af en sofistikeret, multi-faktor kvantitativ model, der identificerer virksomheder med de højeste niveauer af institutionel akkumulering. Scoringsmodellen bruger en kombination af den samlede stigning i oplyste ejere, ændringerne i porteføljeallokeringer i disse ejere og andre målinger. Tallet går fra 0 til 100, hvor højere tal indikerer et højere niveau af akkumulering for sine jævnaldrende, og 50 er gennemsnittet.
Opdateringsfrekvens: Dagligt
Se Ownership Explorer, som giver en liste over højest rangerende virksomheder.
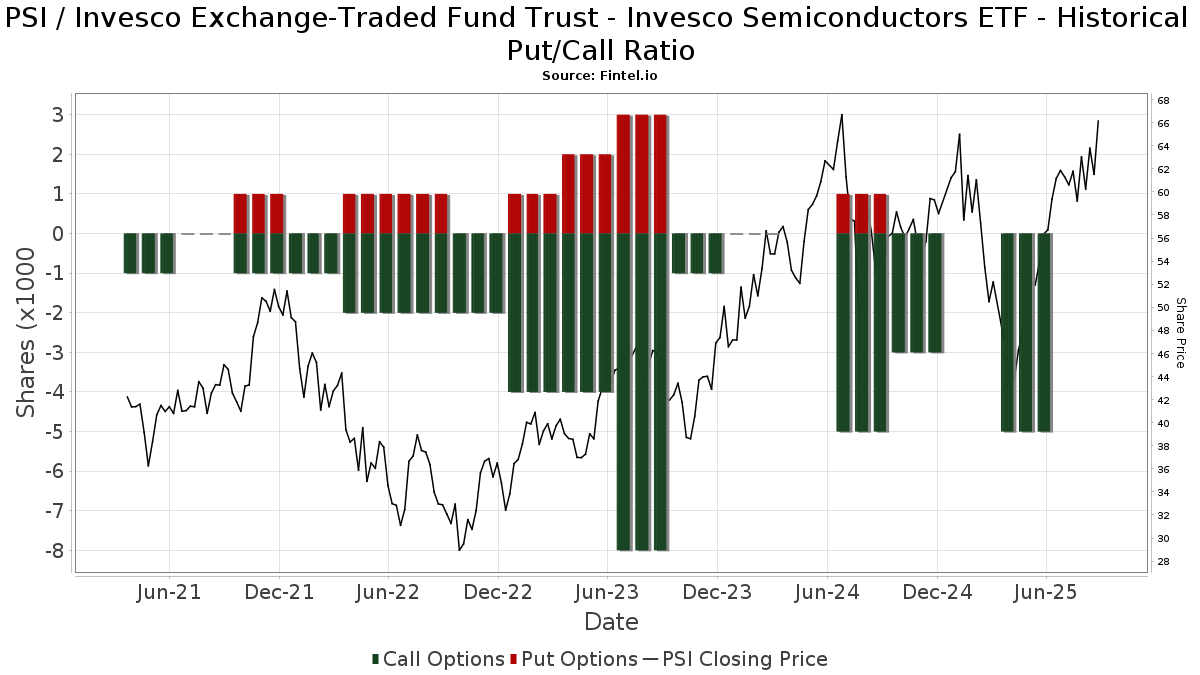
Institutionel Put/Call-forhold
Ud over at indberette standardaktie- og gældsudstedelser skal institutter med mere end 100 mill. aktiver under forvaltning også oplyse deres put- og call-optionsbeholdninger. Da salgsoptioner generelt indikerer negativ stemning, og købsoptioner indikerer positiv stemning, kan vi få en fornemmelse af den overordnede institutionelle stemning ved at plotte forholdet mellem put og kald. Diagrammet til højre viser det historiske put/call-forhold for dette instrument.
Brug af Put/Call Ratio som en indikator for investorernes stemning overvinder en af de vigtigste mangler ved at bruge totalt institutionelt ejerskab, som er, at en betydelig mængde af aktiver under forvaltning investeres passivt for at spore indekser. Passivt forvaltede fonde køber typisk ikke optioner, så indikatoren for put/call-forholdet følger mere nøje følelsen af aktivt forvaltede fonde.
13F og NPORT arkivering
Detaljer om 13F-arkivering er gratis. Detaljer om NP-ansøgninger kræver et premium-medlemskab. Grønne rækker angiver nye positioner. Røde rækker angiver lukkede positioner. Klik på linket ikon for at se den fulde transaktionshistorik.
Opgrader
for at låse premium-data op og eksportere til Excel ![]() .
.
| Fil dato | Kilde | Investor | Type | Gennemsnitlig pris (Øst) |
Aktier | Δ Aktier (%) |
Rapporteret Værdi ($1000) |
Δ Værdi (%) |
Port Alloc (%) |
|
|---|---|---|---|---|---|---|---|---|---|---|
| 2025-07-24 | 13F | WMG Financial Advisors, LLC | 4.413 | -0,45 | 265 | 25,71 | ||||
| 2025-08-06 | 13F | Aspect Partners, LLC | 911 | 0,00 | 55 | 25,58 | ||||
| 2025-08-14 | 13F | Susquehanna International Group, Llp | 19.542 | 232,86 | 1.172 | 321,22 | ||||
| 2025-05-14 | 13F | Capital Wealth Alliance, LLC | 0 | -100,00 | 0 | |||||
| 2025-08-14 | 13F | CoreCap Advisors, LLC | 564 | 0,00 | 34 | 26,92 | ||||
| 2025-08-14 | 13F | Wells Fargo & Company/mn | 2.101 | 249,00 | 126 | 346,43 | ||||
| 2025-08-14 | 13F | Federation des caisses Desjardins du Quebec | 130 | 8 | ||||||
| 2025-05-02 | 13F | Signaturefd, Llc | 0 | -100,00 | 0 | |||||
| 2025-08-14 | 13F | Bank Of America Corp /de/ | 188.920 | -0,63 | 11.328 | 25,76 | ||||
| 2025-07-10 | 13F | Wealth Enhancement Advisory Services, Llc | 3.264 | -16,09 | 202 | -9,87 | ||||
| 2025-08-13 | 13F | Millington Financial Advisors, LLC | 0 | -100,00 | 0 | |||||
| 2025-07-18 | 13F | Truist Financial Corp | 5.448 | -0,13 | 327 | 26,36 | ||||
| 2025-08-11 | 13F | Private Advisor Group, LLC | 44.679 | 7,96 | 2.679 | 36,63 | ||||
| 2025-08-12 | 13F | LPL Financial LLC | 335.368 | -43,78 | 20.109 | -28,86 | ||||
| 2025-08-04 | 13F | Flagship Harbor Advisors, Llc | 8.049 | -2,31 | 483 | 23,59 | ||||
| 2025-08-25 | 13F/A | Neuberger Berman Group LLC | 4.323 | 0,00 | 259 | 26,96 | ||||
| 2025-08-14 | 13F | IHT Wealth Management, LLC | 4.954 | 297 | ||||||
| 2025-08-14 | 13F | Comerica Bank | 47 | 0,00 | 3 | 0,00 | ||||
| 2025-08-14 | 13F | Arete Wealth Advisors, LLC | 34.741 | 2 | ||||||
| 2025-07-24 | 13F | Ulland Investment Advisors, LLC | 5.010 | -51,01 | 0 | |||||
| 2025-07-22 | 13F | Valley National Advisers Inc | 2.071 | 0,00 | 0 | |||||
| 2025-08-12 | 13F | Steward Partners Investment Advisory, Llc | 415 | 0,00 | 25 | 26,32 | ||||
| 2025-07-22 | 13F | Wealthcare Advisory Partners LLC | 4.161 | 249 | ||||||
| 2025-07-23 | 13F | Meitav Dash Investments Ltd | 91.446 | 0,00 | 5.483 | 26,57 | ||||
| 2025-05-12 | 13F | Independent Advisor Alliance | 0 | -100,00 | 0 | |||||
| 2025-08-14 | 13F | Bnp Paribas Arbitrage, Sa | 40.000 | 2.398 | ||||||
| 2025-07-30 | 13F | Evermay Wealth Management Llc | 0 | -100,00 | 0 | |||||
| 2025-05-13 | 13F | Tocqueville Asset Management L.p. | 0 | -100,00 | 0 | |||||
| 2025-04-23 | 13F | Mascagni Wealth Management, Inc. | 0 | -100,00 | 0 | -100,00 | ||||
| 2025-08-08 | 13F | Larson Financial Group LLC | 51 | 0,00 | 3 | 50,00 | ||||
| 2025-08-07 | 13F | CENTRAL TRUST Co | 0 | -100,00 | 0 | -100,00 | ||||
| 2025-03-21 | 13F | Prostatis Group LLC | 0 | -100,00 | 0 | -100,00 | ||||
| 2025-08-14 | 13F | First Foundation Advisors | 7.022 | 0,00 | 421 | 26,81 | ||||
| 2025-08-14 | 13F | Goldman Sachs Group Inc | 80.371 | 62,45 | 4.819 | 105,59 | ||||
| 2025-07-25 | 13F | Valley Brook Capital Group, Inc. | 10.385 | -6,05 | 623 | 18,93 | ||||
| 2025-08-08 | 13F | WASHINGTON TRUST Co | 0 | -100,00 | 0 | |||||
| 2025-07-22 | 13F | Belpointe Asset Management LLC | 9.462 | 0,00 | 567 | 26,56 | ||||
| 2025-08-11 | 13F | Cornerstone Planning Group LLC | 24 | 1 | ||||||
| 2025-08-12 | 13F | Financial Advocates Investment Management | 0 | -100,00 | 0 | -100,00 | ||||
| 2025-08-14 | 13F | Colony Group, LLC | 5.256 | 0,11 | 315 | 27,02 | ||||
| 2025-07-29 | 13F | Harbor Asset Planning, Inc. | 647 | 39 | ||||||
| 2025-07-31 | 13F | Cambridge Investment Research Advisors, Inc. | 95.123 | -6,00 | 6 | 25,00 | ||||
| 2025-08-04 | 13F | WNY Asset Management, LLC | 3.914 | 235 | ||||||
| 2025-07-30 | 13F | Capstone Triton Financial Group, LLC | 18.530 | 22,31 | 1.111 | 26,68 | ||||
| 2025-07-25 | 13F | Atria Wealth Solutions, Inc. | 9.591 | -56,13 | 575 | -44,44 | ||||
| 2025-05-05 | 13F | J.w. Cole Advisors, Inc. | 0 | -100,00 | 0 | -100,00 | ||||
| 2025-08-14 | 13F | Mercer Global Advisors Inc /adv | 112.225 | 2,62 | 6.729 | 29,86 | ||||
| 2025-08-11 | 13F | Principal Securities, Inc. | 17.958 | -4,92 | 1.077 | -1,56 | ||||
| 2025-08-14 | 13F | UBS Group AG | 137.632 | -21,15 | 8.252 | -0,22 | ||||
| 2025-08-13 | 13F | Cheviot Value Management, LLC | 300 | 0,00 | 18 | 28,57 | ||||
| 2025-08-15 | 13F | Morgan Stanley | 247.211 | -1,77 | 14.823 | 24,31 | ||||
| 2025-08-19 | 13F | Advisory Services Network, LLC | 48.932 | -5,22 | 2.911 | 19,01 | ||||
| 2025-08-15 | 13F | Captrust Financial Advisors | 243.386 | 33,16 | 14.593 | 68,53 | ||||
| 2025-07-24 | 13F | Blair William & Co/il | 8 | 0,00 | 0 | |||||
| 2025-07-30 | 13F | Whittier Trust Co Of Nevada Inc | 2.972 | 178 | ||||||
| 2025-07-22 | 13F | Grimes & Company, Inc. | 8.553 | 513 | ||||||
| 2025-08-08 | 13F | Cetera Investment Advisers | 207.094 | 5,96 | 12.417 | 34,09 | ||||
| 2025-08-05 | 13F | Tsfg, Llc | 0 | -100,00 | 0 | |||||
| 2025-04-25 | 13F | Sovran Advisors, LLC | 0 | -100,00 | 0 | |||||
| 2025-05-02 | 13F | Transcendent Capital Group LLC | 0 | -100,00 | 0 | |||||
| 2025-08-13 | 13F | Summit Financial, LLC | 19.656 | 1.179 | ||||||
| 2025-08-14 | 13F | Sunbelt Securities, Inc. | 31 | 0,00 | 2 | 0,00 | ||||
| 2025-08-14 | 13F | Money Concepts Capital Corp | 4.187 | 251 | ||||||
| 2025-07-15 | 13F | Main Street Group, LTD | 121 | 0,00 | 7 | 40,00 | ||||
| 2025-08-14 | 13F | Jane Street Group, Llc | 14.722 | 29,19 | 883 | 63,64 | ||||
| 2025-09-11 | 13F | Silicon Valley Capital Partners | 302 | 18 | ||||||
| 2025-08-15 | 13F | Tower Research Capital LLC (TRC) | 11.916 | 169,96 | 714 | 241,63 | ||||
| 2025-07-15 | 13F | Carr Financial Group Corp | 0 | -100,00 | 0 | |||||
| 2025-08-06 | 13F | Prospera Financial Services Inc | 14.857 | 3,22 | 891 | 30,65 | ||||
| 2025-07-15 | 13F | Capstone Wealth Management Group LLC | 3.452 | 207 | ||||||
| 2025-08-06 | 13F | AE Wealth Management LLC | 9.746 | 5,02 | 584 | 33,03 | ||||
| 2025-08-13 | 13F | Northwestern Mutual Wealth Management Co | 35.207 | -33,78 | 2.111 | -16,20 | ||||
| 2025-07-31 | 13F | Sage Mountain Advisors LLC | 190 | 0,00 | 11 | 22,22 | ||||
| 2025-07-30 | 13F | Strategic Blueprint, LLC | 25.044 | 1,93 | 1.502 | 28,95 | ||||
| 2025-08-11 | 13F | HighTower Advisors, LLC | 176.111 | 3.894,35 | 10.560 | 4.976,44 | ||||
| 2025-07-18 | 13F | Institute for Wealth Management, LLC. | 4.365 | 0,00 | 262 | 26,70 | ||||
| 2025-08-11 | 13F | Aptus Capital Advisors, LLC | 50 | 100,00 | 3 | 100,00 | ||||
| 2025-07-18 | 13F | PFG Investments, LLC | 8.970 | 0,92 | 538 | 27,55 | ||||
| 2025-08-12 | 13F | CIBC Private Wealth Group, LLC | 795 | 0,00 | 48 | 51,61 | ||||
| 2025-07-29 | 13F | Private Trust Co Na | 1.049 | 0,00 | 63 | 26,53 | ||||
| 2025-08-01 | 13F | Envestnet Asset Management Inc | 141.803 | -7,71 | 8.503 | 16,80 | ||||
| 2025-08-14 | 13F | Lebenthal Global Advisors, LLC | 3.950 | 237 | ||||||
| 2025-07-08 | 13F | Nbc Securities, Inc. | 957 | -5,90 | 0 | |||||
| 2025-08-11 | 13F | SFI Advisors, LLC | 13.048 | -8,38 | 782 | 16,02 | ||||
| 2025-08-14 | 13F | Integrated Wealth Concepts LLC | 14.917 | 0,61 | 894 | 27,35 | ||||
| 2025-08-18 | 13F/A | National Bank Of Canada /fi/ | 82.405 | 4,27 | 4.941 | 31,87 | ||||
| 2025-08-12 | 13F | Argent Trust Co | 4.803 | 0,00 | 288 | 26,43 | ||||
| 2025-04-28 | 13F | Strategic Financial Concepts, LLC | 0 | -100,00 | 0 | -100,00 | ||||
| 2025-05-06 | 13F | Proficio Capital Partners LLC | 0 | -100,00 | 0 | -100,00 | ||||
| 2025-08-05 | 13F | Bank Of Montreal /can/ | 482 | -45,54 | 29 | -31,71 | ||||
| 2025-08-14 | 13F | Ameriprise Financial Inc | 151.834 | 833,90 | 9.129 | 1.085,45 | ||||
| 2025-07-21 | 13F | Ameriflex Group, Inc. | 17 | 0,00 | 1 | |||||
| 2025-08-19 | 13F | National Asset Management, Inc. | 12.129 | -49,14 | 727 | -47,36 | ||||
| 2025-05-16 | 13F | Coppell Advisory Solutions LLC | 0 | -100,00 | 0 | |||||
| 2025-07-11 | 13F | Farther Finance Advisors, LLC | 1.005 | 458,33 | 60 | 650,00 | ||||
| 2025-08-14 | 13F | Citadel Advisors Llc | 12.949 | 776 | ||||||
| 2025-07-28 | 13F | Mission Hills Financial Advisory, LLC | 15.524 | -1,95 | 931 | 24,00 | ||||
| 2025-07-31 | 13F | Oppenheimer & Co Inc | 10.763 | 75,78 | 645 | 122,41 | ||||
| 2025-08-04 | 13F | Kovack Advisors, Inc. | 4.987 | -8,78 | 299 | 15,44 | ||||
| 2025-05-06 | 13F | Venturi Wealth Management, LLC | 0 | -100,00 | 0 | |||||
| 2025-08-07 | 13F | Atala Financial Inc | 0 | -100,00 | 0 | |||||
| 2025-08-07 | 13F | PFG Advisors | 5.229 | 314 | ||||||
| 2025-05-12 | 13F | Y.D. More Investments Ltd | 0 | -100,00 | 0 | |||||
| 2025-08-12 | 13F | Jpmorgan Chase & Co | 3.744 | 0,00 | 224 | 26,55 | ||||
| 2025-08-14 | 13F | Raymond James Financial Inc | 99.852 | -16,58 | 5.987 | 5,57 | ||||
| 2025-08-12 | 13F | O'shaughnessy Asset Management, Llc | 0 | -100,00 | 0 | |||||
| 2025-09-04 | 13F/A | Advisor Group Holdings, Inc. | 62.568 | -20,81 | 3.751 | 0,21 | ||||
| 2025-04-21 | 13F | SILVER OAK SECURITIES, Inc | 0 | -100,00 | 0 | |||||
| 2025-08-11 | 13F | Capital Square, LLC | 5.812 | 1,75 | 359 | 32,59 | ||||
| 2025-08-14 | 13F | Benjamin Edwards Inc | 7.354 | 441 | ||||||
| 2025-07-14 | 13F | Sowell Financial Services LLC | 0 | -100,00 | 0 | |||||
| 2025-08-14 | 13F | Mariner, LLC | 8.500 | 7,36 | 510 | 35,73 | ||||
| 2025-07-16 | 13F | Perigon Wealth Management, LLC | 4.405 | 0,00 | 264 | 26,92 | ||||
| 2025-08-06 | 13F | Commonwealth Equity Services, Llc | 65.759 | -4,04 | 4 | 0,00 | ||||
| 2025-08-06 | 13F | Mark Sheptoff Financial Planning, Llc | 175 | 0,00 | 10 | 25,00 | ||||
| 2025-05-01 | 13F | Fifth Third Securities, Inc. | 0 | -100,00 | 0 | |||||
| 2025-08-14 | 13F | Fmr Llc | 2.023 | -23,83 | 121 | -3,20 | ||||
| 2025-08-14 | 13F | Royal Bank Of Canada | 74.651 | -18,21 | 4.476 | 3,49 | ||||
| 2025-08-12 | 13F | Yahav Achim Ve Achayot - Provident Funds Management Co Ltd. | 19.122 | 0,00 | 1.147 | 26,74 | ||||
| 2025-05-15 | 13F | StoneX Group Inc. | 0 | -100,00 | 0 | -100,00 | ||||
| 2025-08-04 | 13F | Spire Wealth Management | 2.456 | -1,92 | 147 | 24,58 | ||||
| 2025-08-12 | 13F | Proequities, Inc. | 0 | 0 | ||||||
| 2025-08-08 | 13F | Pnc Financial Services Group, Inc. | 9.070 | -18,66 | 544 | 2,84 | ||||
| 2025-08-12 | 13F | Global Retirement Partners, LLC | 1.408 | 0,00 | 84 | 3,70 | ||||
| 2025-05-12 | 13F | Citigroup Inc | 0 | -100,00 | 0 | |||||
| 2025-08-07 | 13F | Kestra Private Wealth Services, Llc | 5.196 | -23,96 | 312 | -3,72 | ||||
| 2025-07-17 | 13F | Sound Income Strategies, LLC | 29 | 2 | ||||||
| 2025-07-18 | 13F | McGuire Investment Group, LLC | 4.698 | 0,00 | 282 | 26,58 | ||||
| 2025-08-14 | 13F | Optiver Holding B.V. | 24.207 | 1.451 | ||||||
| 2025-05-15 | 13F | CAPROCK Group, Inc. | 12.564 | 0,00 | 595 | -18,16 | ||||
| 2025-07-28 | 13F | Harbour Investments, Inc. | 4.657 | -9,68 | 279 | 14,34 | ||||
| 2025-07-21 | 13F | DHJJ Financial Advisors, Ltd. | 1 | 0,00 | 0 | |||||
| 2025-08-06 | 13F | Golden State Wealth Management, LLC | 75 | 0,00 | 5 | 33,33 | ||||
| 2025-08-14 | 13F | EP Wealth Advisors, Inc. | 7.856 | -47,79 | 471 | -33,85 | ||||
| 2025-08-14 | 13F | KKM Financial LLC | 6.850 | -10,02 | 411 | 13,89 | ||||
| 2025-08-01 | 13F | Belvedere Trading LLC | Call | 5.600 | 336 | |||||
| 2025-08-01 | 13F | Belvedere Trading LLC | Put | 700 | 42 | |||||
| 2025-05-01 | 13F | WESPAC Advisors, LLC | 0 | -100,00 | 0 | |||||
| 2025-08-05 | 13F | Simplex Trading, Llc | 753 | 818,29 | 0 | |||||
| 2025-08-14 | 13F | Mml Investors Services, Llc | 85.783 | -29,05 | 5 | 0,00 | ||||
| 2025-08-04 | 13F | Bay Colony Advisory Group, Inc d/b/a Bay Colony Advisors | 9.279 | -1,56 | 556 | 23,83 | ||||
| 2025-08-19 | 13F | Newbridge Financial Services Group, Inc. | 180 | -21,74 | 11 | 0,00 | ||||
| 2025-07-24 | 13F | Us Bancorp \de\ | 229 | 0,00 | 14 | 30,00 | ||||
| 2025-08-27 | NP | FFOX - FundX Future Fund Opportunities ETF | 510 | 31 | ||||||
| 2025-08-11 | 13F | VSM Wealth Advisory, LLC | 425 | 0,00 | 25 | 25,00 | ||||
| 2025-08-13 | 13F | Jones Financial Companies Lllp | 21.588 | 31,11 | 1.294 | 64,84 | ||||
| 2025-08-13 | 13F | Flow Traders U.s. Llc | 6.095 | 0 | ||||||
| 2025-08-08 | 13F | Mv Capital Management, Inc. | 750 | 0,00 | 45 | 25,71 | ||||
| 2025-08-13 | 13F | M Holdings Securities, Inc. | 20.326 | 1 | ||||||
| 2025-07-17 | 13F | Janney Montgomery Scott LLC | 3.725 | -29,98 | 0 | |||||
| 2025-07-29 | 13F | Koshinski Asset Management, Inc. | 8.448 | -3,26 | 507 | 22,52 | ||||
| 2025-04-29 | 13F | Capital Investment Advisory Services, LLC | 0 | -100,00 | 0 | -100,00 | ||||
| 2025-07-25 | 13F | Cwm, Llc | 9.664 | 31,70 | 1 | |||||
| 2025-08-14 | 13F | Stifel Financial Corp | 14.605 | 876 | ||||||
| 2025-08-14 | 13F | DRW Securities, LLC | 14.024 | 22,16 | 841 | 54,70 | ||||
| 2025-08-08 | 13F | Creative Planning | 5.859 | 351 | ||||||
| 2025-08-05 | 13F | GPS Wealth Strategies Group, LLC | 50 | -28,57 | 3 | -33,33 | ||||
| 2025-04-23 | 13F | Golden State Equity Partners | 0 | -100,00 | 0 |
Other Listings
| MX:PSI |