Grundlæggende statistik
| Institutionelle ejere | 40 total, 36 long only, 0 short only, 4 long/short - change of 8,11% MRQ |
| Gennemsnitlig porteføljeallokering | 0.0188 % - change of 2,63% MRQ |
| Institutionelle aktier (lange) | 611.695 (ex 13D/G) - change of -0,18MM shares -22,46% MRQ |
| Institutionel værdi (lang) | $ 9.248 USD ($1000) |
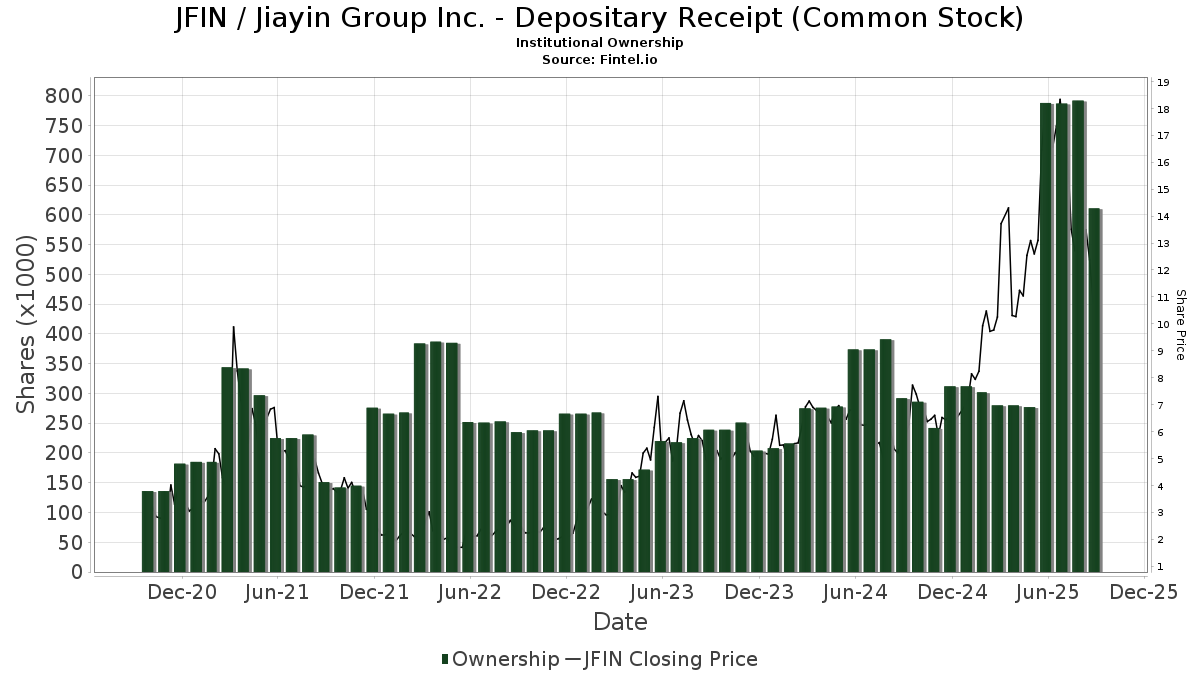
Institutionelt ejerskab og aktionærer
Jiayin Group Inc. - Depositary Receipt (Common Stock) (US:JFIN) har 40 institutionelle ejere og aktionærer, der har indsendt 13D/G- eller 13F-formularer til Securities Exchange Commission (SEC). Disse institutioner har i alt 611,695 aktier. Største aktionærer omfatter Susquehanna International Group, Llp, Morgan Stanley, Susquehanna International Group, Llp, Susquehanna International Group, Llp, Renaissance Technologies Llc, Citadel Advisors Llc, Jane Street Group, Llc, Point72 Asset Management, L.P., BPLSX - Boston Partners Long/Short Equity Fund INSTITUTIONAL, and Jane Street Group, Llc .
Jiayin Group Inc. - Depositary Receipt (Common Stock) (NasdaqGM:JFIN) institutionel ejerskabsstruktur viser aktuelle positioner i virksomheden efter institutioner og fonde, samt seneste ændringer i positionsstørrelse. Større aktionærer kan omfatte individuelle investorer, investeringsforeninger, hedgefonde eller institutioner. Skema 13D angiver, at investoren besidder (eller besidder) mere end 5 % af virksomheden og har til hensigt (eller har til hensigt at) aktivt at forfølge en ændring i forretningsstrategi. Skema 13G indikerer en passiv investering på over 5%.
The share price as of September 17, 2025 is 11,30 / share. Previously, on September 17, 2024, the share price was 5,46 / share. This represents an increase of 106,96% over that period.
Fondens stemningsscore
Fund Sentiment Score (fka Ownership Accumulation Score) finder de aktier, der bliver mest købt af fonde. Det er resultatet af en sofistikeret, multi-faktor kvantitativ model, der identificerer virksomheder med de højeste niveauer af institutionel akkumulering. Scoringsmodellen bruger en kombination af den samlede stigning i oplyste ejere, ændringerne i porteføljeallokeringer i disse ejere og andre målinger. Tallet går fra 0 til 100, hvor højere tal indikerer et højere niveau af akkumulering for sine jævnaldrende, og 50 er gennemsnittet.
Opdateringsfrekvens: Dagligt
Se Ownership Explorer, som giver en liste over højest rangerende virksomheder.
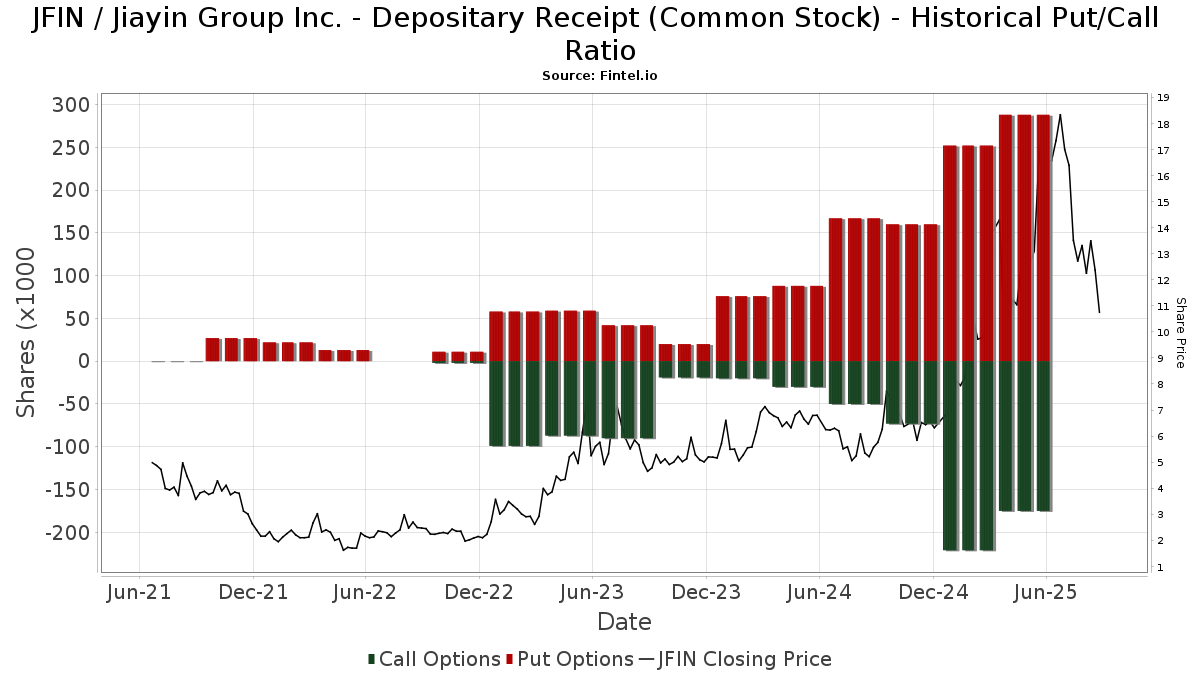
Institutionel Put/Call-forhold
Ud over at indberette standardaktie- og gældsudstedelser skal institutter med mere end 100 mill. aktiver under forvaltning også oplyse deres put- og call-optionsbeholdninger. Da salgsoptioner generelt indikerer negativ stemning, og købsoptioner indikerer positiv stemning, kan vi få en fornemmelse af den overordnede institutionelle stemning ved at plotte forholdet mellem put og kald. Diagrammet til højre viser det historiske put/call-forhold for dette instrument.
Brug af Put/Call Ratio som en indikator for investorernes stemning overvinder en af de vigtigste mangler ved at bruge totalt institutionelt ejerskab, som er, at en betydelig mængde af aktiver under forvaltning investeres passivt for at spore indekser. Passivt forvaltede fonde køber typisk ikke optioner, så indikatoren for put/call-forholdet følger mere nøje følelsen af aktivt forvaltede fonde.
13F og NPORT arkivering
Detaljer om 13F-arkivering er gratis. Detaljer om NP-ansøgninger kræver et premium-medlemskab. Grønne rækker angiver nye positioner. Røde rækker angiver lukkede positioner. Klik på linket ikon for at se den fulde transaktionshistorik.
Opgrader
for at låse premium-data op og eksportere til Excel ![]() .
.
| Fil dato | Kilde | Investor | Type | Gennemsnitlig pris (Øst) |
Aktier | Δ Aktier (%) |
Rapporteret Værdi ($1000) |
Δ Værdi (%) |
Port Alloc (%) |
|
|---|---|---|---|---|---|---|---|---|---|---|
| 2025-08-12 | 13F | BlackRock, Inc. | 222 | 0,00 | 4 | 0,00 | ||||
| 2025-07-18 | 13F | Ewa, Llc | 11.694 | 0,00 | 187 | 16,88 | ||||
| 2025-08-01 | 13F | Belvedere Trading LLC | 438 | -93,26 | 7 | -92,13 | ||||
| 2025-08-14 | 13F | Peak6 Llc | Call | 0 | -100,00 | 0 | ||||
| 2025-08-01 | 13F | Belvedere Trading LLC | Call | 22.500 | -7,41 | 360 | 8,11 | |||
| 2025-08-01 | 13F | Belvedere Trading LLC | Put | 600 | -66,67 | 10 | -62,50 | |||
| 2025-08-13 | 13F | Jump Financial, LLC | 0 | -100,00 | 0 | |||||
| 2025-04-22 | NP | APIE - ActivePassive International Equity ETF | 11.583 | -15,90 | 113 | 28,41 | ||||
| 2025-08-12 | 13F | Virtu Financial LLC | 0 | -100,00 | 0 | |||||
| 2025-08-14 | 13F | Raymond James Financial Inc | 3.916 | 63 | ||||||
| 2025-08-14 | 13F | Wells Fargo & Company/mn | 649 | -56,73 | 10 | -50,00 | ||||
| 2025-08-14 | 13F | UBS Group AG | 222 | -98,97 | 4 | -98,99 | ||||
| 2025-08-08 | 13F | SBI Securities Co., Ltd. | 1 | -88,89 | 0 | |||||
| 2025-08-15 | 13F | Morgan Stanley | 167.627 | 93,81 | 2.685 | 126,01 | ||||
| 2025-08-14 | 13F | Jane Street Group, Llc | Call | 25.300 | 91,67 | 405 | 123,76 | |||
| 2025-07-24 | NP | FNCMX - Fidelity Nasdaq Composite Index Fund This fund is a listed as child fund of Fmr Llc and if that institution has disclosed ownership in this security, then these positions will not be double counted when calculating total shares and total value | 8.973 | 0,00 | 137 | 56,32 | ||||
| 2025-08-14 | 13F | Jane Street Group, Llc | 25.956 | 416 | ||||||
| 2025-08-12 | 13F | Proequities, Inc. | 0 | 0 | ||||||
| 2025-08-18 | 13F/A | Nomura Holdings Inc | 0 | -100,00 | 0 | -100,00 | ||||
| 2025-08-29 | 13F | Total Investment Management Inc | 50 | 1 | ||||||
| 2025-08-14 | 13F | Jane Street Group, Llc | Put | 45.400 | 56,55 | 727 | 82,66 | |||
| 2025-08-14 | 13F | Royal Bank Of Canada | 69 | 1 | ||||||
| 2025-08-12 | 13F/A | Boston Partners | 0 | -100,00 | 0 | -100,00 | ||||
| 2025-09-04 | 13F/A | Advisor Group Holdings, Inc. | 14 | -73,08 | 0 | |||||
| 2025-08-07 | 13F | Allworth Financial LP | 4.224 | 14.985,71 | 68 | |||||
| 2025-08-13 | 13F | Quadrature Capital Ltd | 0 | -100,00 | 0 | |||||
| 2025-08-07 | 13F | Acadian Asset Management Llc | 10.502 | 0 | ||||||
| 2025-08-14 | 13F | Bank Of America Corp /de/ | 145 | -15,20 | 2 | 0,00 | ||||
| 2025-08-14 | 13F | Goldman Sachs Group Inc | 21.502 | 344 | ||||||
| 2025-07-18 | 13F | Newman Dignan & Sheerar, Inc. | 0 | -100,00 | 0 | |||||
| 2025-08-18 | 13F | Wolverine Trading, Llc | 0 | -100,00 | 0 | -100,00 | ||||
| 2025-06-27 | NP | PGJ - Invesco Golden Dragon China ETF This fund is a listed as child fund of Invesco Ltd. and if that institution has disclosed ownership in this security, then these positions will not be double counted when calculating total shares and total value | 12.131 | 134 | ||||||
| 2025-07-24 | 13F | E Fund Management (Hong Kong) Co., Ltd. | 6.243 | 100 | ||||||
| 2025-08-12 | 13F | Rhumbline Advisers | 1.050 | -10,49 | 17 | 0,00 | ||||
| 2025-04-29 | NP | BPLSX - Boston Partners Long/Short Equity Fund INSTITUTIONAL | 31.436 | 4,32 | 307 | 59,38 | ||||
| 2025-08-08 | 13F | Larson Financial Group LLC | 102 | -24,44 | 2 | 0,00 | ||||
| 2025-08-12 | 13F | LPL Financial LLC | 0 | -100,00 | 0 | |||||
| 2025-07-16 | 13F | Signaturefd, Llc | 24 | 0,00 | 0 | |||||
| 2025-08-12 | 13F | Global Retirement Partners, LLC | 2.217 | 36 | ||||||
| 2025-08-12 | 13F | Jpmorgan Chase & Co | 21.229 | 1.226,81 | 340 | 2.990,91 | ||||
| 2025-08-12 | 13F | American Century Companies Inc | 12.409 | 199 | ||||||
| 2025-08-13 | 13F | Invesco Ltd. | 11.463 | -6,01 | 184 | 9,58 | ||||
| 2025-08-14 | 13F | Susquehanna International Group, Llp | 81.164 | 1.300 | ||||||
| 2025-08-14 | 13F | Susquehanna International Group, Llp | Call | 107.600 | -19,46 | 1.724 | -6,10 | |||
| 2025-08-14 | 13F | Susquehanna International Group, Llp | Put | 181.000 | 9,76 | 2.900 | 27,99 | |||
| 2025-08-14 | 13F/A | Barclays Plc | 48 | -99,98 | 0 | -100,00 | ||||
| 2025-07-29 | 13F | Commons Capital, Llc | 11.985 | -29,50 | 192 | -17,60 | ||||
| 2025-08-14 | 13F | Point72 Asset Management, L.P. | 34.969 | 560 | ||||||
| 2025-08-15 | 13F | Tower Research Capital LLC (TRC) | 1.193 | -0,17 | 19 | 18,75 | ||||
| 2025-08-13 | 13F | Renaissance Technologies Llc | 78.722 | 27,38 | 1.261 | 48,53 | ||||
| 2025-08-14 | 13F | Citadel Advisors Llc | Call | 19.900 | -12,72 | 319 | 1,60 | |||
| 2025-08-14 | 13F | Group One Trading, L.p. | 22.431 | 163,80 | 359 | 209,48 | ||||
| 2025-08-05 | 13F | Simplex Trading, Llc | 5.657 | -46,19 | 0 | |||||
| 2025-05-13 | 13F | Beacon Pointe Advisors, LLC | 0 | -100,00 | 0 | |||||
| 2025-07-28 | NP | AVEE - Avantis Emerging Markets Small Cap Equity ETF | 313 | 5 | ||||||
| 2025-05-08 | 13F | XTX Topco Ltd | 0 | -100,00 | 0 | |||||
| 2025-08-11 | 13F | Tidemark, LLC | 4.725 | 0,00 | 76 | 17,19 | ||||
| 2025-07-28 | NP | AVEM - Avantis Emerging Markets Equity ETF This fund is a listed as child fund of American Century Companies Inc and if that institution has disclosed ownership in this security, then these positions will not be double counted when calculating total shares and total value | 10.973 | 167 | ||||||
| 2025-08-14 | 13F | Citadel Advisors Llc | 16.528 | -72,35 | 265 | -67,84 | ||||
| 2025-08-14 | 13F | Citadel Advisors Llc | Put | 61.100 | 7,57 | 979 | 25,38 |