Grundlæggende statistik
| Institutionelle ejere | 133 total, 133 long only, 0 short only, 0 long/short - change of 0,00% MRQ |
| Gennemsnitlig porteføljeallokering | 0.1753 % - change of 17,11% MRQ |
| Institutionelle aktier (lange) | 2.121.175 (ex 13D/G) - change of 0,16MM shares 8,08% MRQ |
| Institutionel værdi (lang) | $ 217.438 USD ($1000) |
Institutionelt ejerskab og aktionærer
iShares Trust - iShares Global Financials ETF (US:IXG) har 133 institutionelle ejere og aktionærer, der har indsendt 13D/G- eller 13F-formularer til Securities Exchange Commission (SEC). Disse institutioner har i alt 2,121,175 aktier. Største aktionærer omfatter Morgan Stanley, Bank Of America Corp /de/, Pictet Asset Management Holding SA, Johnson Bixby & Associates, LLC, EWG Elevate Inc., Flow Traders U.s. Llc, Cambria Investment Management, L.P., Ameriprise Financial Inc, GMOM - Cambria Global Momentum ETF, and Banco Santander, S.A. .
iShares Trust - iShares Global Financials ETF (ARCA:IXG) institutionel ejerskabsstruktur viser aktuelle positioner i virksomheden efter institutioner og fonde, samt seneste ændringer i positionsstørrelse. Større aktionærer kan omfatte individuelle investorer, investeringsforeninger, hedgefonde eller institutioner. Skema 13D angiver, at investoren besidder (eller besidder) mere end 5 % af virksomheden og har til hensigt (eller har til hensigt at) aktivt at forfølge en ændring i forretningsstrategi. Skema 13G indikerer en passiv investering på over 5%.
The share price as of September 17, 2025 is 116,43 / share. Previously, on September 18, 2024, the share price was 93,25 / share. This represents an increase of 24,86% over that period.

Fondens stemningsscore
Fund Sentiment Score (fka Ownership Accumulation Score) finder de aktier, der bliver mest købt af fonde. Det er resultatet af en sofistikeret, multi-faktor kvantitativ model, der identificerer virksomheder med de højeste niveauer af institutionel akkumulering. Scoringsmodellen bruger en kombination af den samlede stigning i oplyste ejere, ændringerne i porteføljeallokeringer i disse ejere og andre målinger. Tallet går fra 0 til 100, hvor højere tal indikerer et højere niveau af akkumulering for sine jævnaldrende, og 50 er gennemsnittet.
Opdateringsfrekvens: Dagligt
Se Ownership Explorer, som giver en liste over højest rangerende virksomheder.
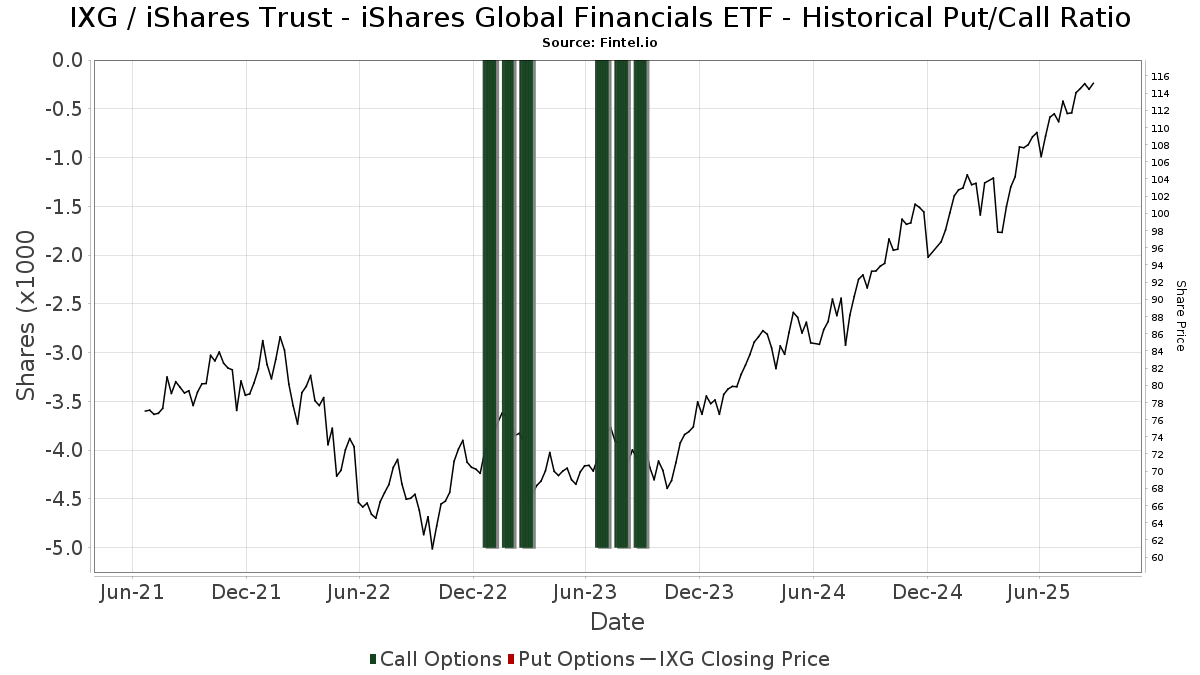
Institutionel Put/Call-forhold
Ud over at indberette standardaktie- og gældsudstedelser skal institutter med mere end 100 mill. aktiver under forvaltning også oplyse deres put- og call-optionsbeholdninger. Da salgsoptioner generelt indikerer negativ stemning, og købsoptioner indikerer positiv stemning, kan vi få en fornemmelse af den overordnede institutionelle stemning ved at plotte forholdet mellem put og kald. Diagrammet til højre viser det historiske put/call-forhold for dette instrument.
Brug af Put/Call Ratio som en indikator for investorernes stemning overvinder en af de vigtigste mangler ved at bruge totalt institutionelt ejerskab, som er, at en betydelig mængde af aktiver under forvaltning investeres passivt for at spore indekser. Passivt forvaltede fonde køber typisk ikke optioner, så indikatoren for put/call-forholdet følger mere nøje følelsen af aktivt forvaltede fonde.
13F og NPORT arkivering
Detaljer om 13F-arkivering er gratis. Detaljer om NP-ansøgninger kræver et premium-medlemskab. Grønne rækker angiver nye positioner. Røde rækker angiver lukkede positioner. Klik på linket ikon for at se den fulde transaktionshistorik.
Opgrader
for at låse premium-data op og eksportere til Excel ![]() .
.
| Fil dato | Kilde | Investor | Type | Gennemsnitlig pris (Øst) |
Aktier | Δ Aktier (%) |
Rapporteret Værdi ($1000) |
Δ Værdi (%) |
Port Alloc (%) |
|
|---|---|---|---|---|---|---|---|---|---|---|
| 2025-08-14 | 13F | Integrated Wealth Concepts LLC | 2.755 | 11,40 | 305 | 20,08 | ||||
| 2025-07-14 | 13F | UMA Financial Services, Inc. | 88 | 46,67 | 10 | 50,00 | ||||
| 2025-07-10 | 13F | Wedmont Private Capital | 2.042 | 228 | ||||||
| 2025-09-04 | 13F/A | Advisor Group Holdings, Inc. | 20.884 | 2,31 | 2.316 | 9,98 | ||||
| 2025-08-12 | 13F | Gladstone Institutional Advisory LLC | 3.169 | 29,29 | 351 | 39,29 | ||||
| 2025-08-14 | 13F | Fmr Llc | 1.463 | 9,59 | 162 | 18,25 | ||||
| 2025-08-13 | 13F | Russell Investments Group, Ltd. | 125 | 0,00 | 14 | 8,33 | ||||
| 2025-08-13 | 13F | Flow Traders U.s. Llc | 74.100 | 8 | ||||||
| 2025-06-27 | NP | TRTY - Cambria Trinity ETF | 10.607 | -57,53 | 1.093 | -57,14 | ||||
| 2025-08-11 | 13F | Cornerstone Planning Group LLC | 15 | 0,00 | 2 | 0,00 | ||||
| 2025-08-05 | 13F | Advisors Preferred, LLC | 0 | -100,00 | 0 | |||||
| 2025-07-08 | 13F | Parallel Advisors, LLC | 0 | -100,00 | 0 | |||||
| 2025-07-29 | 13F | MPS Loria Financial Planners, LLC | 0 | -100,00 | 0 | |||||
| 2025-08-12 | 13F | Proequities, Inc. | 0 | 0 | ||||||
| 2025-08-19 | 13F | Anchor Investment Management, LLC | 10 | 0,00 | 1 | 0,00 | ||||
| 2025-08-14 | 13F | Ameriprise Financial Inc | 64.386 | 174,90 | 7.145 | 196,19 | ||||
| 2025-05-08 | 13F | ICICI Prudential Asset Management Co Ltd | 0 | -100,00 | 0 | |||||
| 2025-08-13 | 13F | M&t Bank Corp | 24.300 | 0,00 | 2.693 | 7,55 | ||||
| 2025-08-04 | 13F | Spire Wealth Management | 1.607 | -40,83 | 178 | -36,20 | ||||
| 2025-07-31 | 13F | Money Design Co.,Ltd. | 23.373 | -5,21 | 3 | 0,00 | ||||
| 2025-08-05 | 13F | Bank Of Montreal /can/ | 983 | 0,00 | 109 | 6,93 | ||||
| 2025-07-22 | 13F | Partners Wealth Management, Llc | 2.467 | 0,00 | 254 | -0,39 | ||||
| 2025-08-15 | 13F | Kestra Advisory Services, LLC | 8.517 | 9,15 | 944 | 17,43 | ||||
| 2025-07-15 | 13F | EWG Elevate Inc. | 101.304 | 946,31 | 11.226 | 1.025,98 | ||||
| 2025-08-08 | 13F | Larson Financial Group LLC | 100 | 0,00 | 11 | 10,00 | ||||
| 2025-05-01 | 13F | Quest 10 Wealth Builders, Inc. | 26 | 0,00 | 3 | 0,00 | ||||
| 2025-08-12 | 13F | Jpmorgan Chase & Co | 166 | -7,26 | 18 | 0,00 | ||||
| 2025-07-16 | 13F/A | CX Institutional | 44 | 0,00 | 0 | |||||
| 2025-08-08 | 13F | Comprehensive Financial Planning, Inc./PA | 0 | -100,00 | 0 | |||||
| 2025-08-06 | 13F | Commonwealth Equity Services, Llc | 6.185 | 18,65 | 1 | |||||
| 2025-08-13 | 13F | Fisher Asset Management, LLC | 6.680 | 6,68 | 740 | 14,73 | ||||
| 2025-08-06 | 13F | Richard Bernstein Advisors LLC | 2 | 0,00 | 0 | |||||
| 2025-08-14 | 13F | DZ BANK AG Deutsche Zentral Genossenschafts Bank, Frankfurt am Main | 7.640 | 0,00 | 847 | 7,50 | ||||
| 2025-07-17 | 13F | Sound Income Strategies, LLC | 481 | 0,00 | 53 | 8,16 | ||||
| 2025-08-14 | 13F | Snowden Capital Advisors LLC | 9.801 | 12,38 | 1.086 | 20,94 | ||||
| 2025-05-15 | 13F | Ancora Advisors, LLC | 0 | -100,00 | 0 | |||||
| 2025-07-18 | 13F | Client 1st Advisory Group, Llc | 1.812 | -10,43 | 201 | -3,85 | ||||
| 2025-07-31 | 13F/A | Avion Wealth | 151 | 0,00 | 0 | |||||
| 2025-08-14 | 13F | Sunbelt Securities, Inc. | 897 | 199,00 | 86 | 186,67 | ||||
| 2025-08-14 | 13F | UBS Group AG | 11.413 | -4,05 | 1.265 | 3,18 | ||||
| 2025-07-18 | 13F | Lynx Investment Advisory | 2.199 | -14,83 | 244 | -8,30 | ||||
| 2025-05-05 | 13F | Mandatum Life Insurance Co Ltd | 0 | -100,00 | 0 | -100,00 | ||||
| 2025-07-18 | 13F | Provident Wealth Management, LLC | 600 | 0,00 | 66 | 8,20 | ||||
| 2025-07-24 | 13F | Ronald Blue Trust, Inc. | 44 | 0,00 | 5 | 0,00 | ||||
| 2025-08-08 | 13F | SBI Securities Co., Ltd. | 308 | 9,22 | 34 | 17,24 | ||||
| 2025-07-16 | 13F | MontVue Capital Management, Inc. | 2.375 | 263 | ||||||
| 2025-07-28 | 13F | Harbour Investments, Inc. | 476 | -18,49 | 53 | -13,33 | ||||
| 2025-08-06 | 13F | AE Wealth Management LLC | 1 | -99,34 | 0 | -100,00 | ||||
| 2025-07-08 | 13F | Rise Advisors, LLC | 72 | 1,41 | 8 | 0,00 | ||||
| 2025-07-17 | 13F | Janney Montgomery Scott LLC | 7.644 | 27,91 | 1 | |||||
| 2025-08-12 | 13F | Coldstream Capital Management Inc | 0 | -100,00 | 0 | |||||
| 2025-08-12 | 13F | Edmond De Rothschild Holding S.a. | 335 | -23,52 | 37 | -17,78 | ||||
| 2025-07-28 | 13F | Founders Grove Wealth Partners, Llc | 16.468 | 9,98 | 1.825 | 18,29 | ||||
| 2025-07-17 | 13F | Johnson Bixby & Associates, LLC | 129.625 | 2,03 | 14.365 | 9,76 | ||||
| 2025-08-14 | 13F | Susquehanna International Group, Llp | 3.741 | 0,00 | 415 | 7,53 | ||||
| 2025-08-12 | 13F | Founders Financial Alliance, LLC | 300 | 0,00 | 33 | 10,00 | ||||
| 2025-08-07 | 13F | Flagship Wealth Advisors, Llc | 75 | 0,00 | 8 | 14,29 | ||||
| 2025-08-07 | 13F | Kestra Private Wealth Services, Llc | 2.360 | 262 | ||||||
| 2025-05-15 | 13F | Gts Securities Llc | 0 | -100,00 | 0 | |||||
| 2025-08-12 | 13F | Franklin Resources Inc | 510 | 0,00 | 57 | 7,69 | ||||
| 2025-08-13 | 13F | Jones Financial Companies Lllp | 3.262 | 54,09 | 360 | 65,90 | ||||
| 2025-05-05 | 13F | Lindbrook Capital, Llc | 0 | -100,00 | 0 | |||||
| 2025-08-07 | 13F | LOM Asset Management Ltd | 7.530 | 1 | ||||||
| 2025-05-08 | NP | QALTX - Quantified Alternative Investment Fund Investor Class Shares | 6.032 | -58,99 | 621 | -56,02 | ||||
| 2025-08-14 | 13F | Stifel Financial Corp | 1.877 | 208 | ||||||
| 2025-07-25 | 13F | Cwm, Llc | 2.633 | -9,71 | 0 | |||||
| 2025-08-13 | 13F | Cambria Investment Management, L.P. | 71.390 | -17,68 | 7.911 | -11,45 | ||||
| 2025-08-15 | 13F | Morgan Stanley | 406.602 | 2,59 | 45.060 | 10,35 | ||||
| 2025-08-07 | 13F | Resources Investment Advisors, LLC. | 2.012 | 223 | ||||||
| 2025-08-12 | 13F | SRS Capital Advisors, Inc. | 207 | 0,00 | 23 | 4,76 | ||||
| 2025-08-11 | 13F | Blue Bell Private Wealth Management, Llc | 15 | 0,00 | 2 | 0,00 | ||||
| 2025-05-16 | 13F | Coppell Advisory Solutions LLC | 0 | -100,00 | 0 | |||||
| 2025-08-13 | 13F | Cresset Asset Management, LLC | 18.824 | -27,06 | 2.086 | -21,52 | ||||
| 2025-08-12 | 13F | Steward Partners Investment Advisory, Llc | 599 | -8,83 | 66 | -1,49 | ||||
| 2025-08-08 | 13F | Hartland & Co., LLC | 650 | 0,00 | 72 | 9,09 | ||||
| 2025-07-24 | 13F | Blair William & Co/il | 230 | 0,00 | 25 | 8,70 | ||||
| 2025-08-18 | 13F/A | National Bank Of Canada /fi/ | 3.563 | -2,60 | 395 | 4,79 | ||||
| 2025-08-08 | 13F | Creative Planning | 4.860 | 0,00 | 539 | 7,60 | ||||
| 2025-07-17 | 13F | Beacon Capital Management, LLC | 1.091 | 1,30 | 121 | 9,09 | ||||
| 2025-08-14 | 13F | Bank Of America Corp /de/ | 282.050 | 12,81 | 31.257 | 21,35 | ||||
| 2025-08-13 | 13F | Pictet Asset Management Holding SA | 211.300 | -34,40 | 23.351 | -29,30 | ||||
| 2025-07-23 | 13F | Nbt Bank N A /ny | 304 | 0,00 | 34 | 6,45 | ||||
| 2025-07-29 | 13F | International Assets Investment Management, Llc | 2.639 | 0,00 | 292 | 7,75 | ||||
| 2025-08-13 | 13F | Cerity Partners LLC | 5.185 | -16,48 | 575 | -10,17 | ||||
| 2025-08-14 | 13F | Wells Fargo & Company/mn | 27.620 | 57,85 | 3.061 | 69,81 | ||||
| 2025-08-14 | 13F | CIBC World Markets Inc. | 2.360 | 0,00 | 262 | 7,41 | ||||
| 2025-06-27 | NP | GMOM - Cambria Global Momentum ETF | 60.783 | -8,93 | 6.265 | -8,09 | ||||
| 2025-07-31 | 13F | Sentinel Trust Co Lba | 15.800 | 0,00 | 2 | 0,00 | ||||
| 2025-08-26 | NP | Forethought Variable Insurance Trust - Global Atlantic BlackRock Selects Managed Risk Portfolio (formerly Global Atlantic BlackRock Global Allocation Managed Risk Portfolio) Global Atlantic BlackRock Global Allocation Managed Risk Portfolio | 42.054 | 54,76 | 4.660 | 66,49 | ||||
| 2025-05-09 | 13F | Emerald Investment Partners, Llc | 0 | -100,00 | 0 | |||||
| 2025-07-15 | 13F | Fifth Third Bancorp | 2.888 | 0,00 | 320 | 7,74 | ||||
| 2025-07-17 | 13F | Youngs Advisory Group, Inc. | 4.450 | 3,61 | 494 | 11,76 | ||||
| 2025-08-12 | 13F | Global Retirement Partners, LLC | 291 | 0,69 | 32 | 18,52 | ||||
| 2025-08-15 | 13F | Equitable Holdings, Inc. | 4.830 | -41,03 | 535 | -36,54 | ||||
| 2025-07-16 | 13F | Brown, Lisle/cummings, Inc. | 35 | 0,00 | 4 | 0,00 | ||||
| 2025-08-11 | 13F | Private Advisor Group, LLC | 6.327 | 3,94 | 701 | 11,80 | ||||
| 2025-08-18 | 13F | Front Row Advisors LLC | 2.015 | -11,08 | 223 | -4,29 | ||||
| 2025-08-12 | 13F | BlackRock, Inc. | 42.054 | 54,76 | 4.660 | 66,49 | ||||
| 2025-07-23 | 13F | Vontobel Holding Ltd. | 4.000 | -33,33 | 443 | -28,32 | ||||
| 2025-08-14 | 13F | Riggs Asset Managment Co. Inc. | 233 | 0,00 | 26 | 4,17 | ||||
| 2025-05-12 | 13F | Sandy Spring Bank | 398 | 0,00 | 41 | 7,89 | ||||
| 2025-07-21 | 13F | Mirae Asset Global Investments Co., Ltd. | 4.300 | -53,41 | 477 | -49,68 | ||||
| 2025-07-14 | 13F | AdvisorNet Financial, Inc | 112 | 1,82 | 12 | 9,09 | ||||
| 2025-08-14 | 13F | CoreCap Advisors, LLC | 6 | 0,00 | 1 | |||||
| 2025-08-04 | 13F | Creative Financial Designs Inc /adv | 26 | 4,00 | 3 | 0,00 | ||||
| 2025-08-01 | 13F | Envestnet Asset Management Inc | 5.421 | -4,17 | 601 | 3,09 | ||||
| 2025-08-14 | 13F | Comerica Bank | 1.276 | 4,33 | 141 | 12,80 | ||||
| 2025-07-29 | 13F | Signature Estate & Investment Advisors Llc | 2.264 | 0,98 | 251 | 8,23 | ||||
| 2025-08-08 | 13F | Pnc Financial Services Group, Inc. | 30 | 0,00 | 3 | 0,00 | ||||
| 2025-08-12 | 13F | Wayfinding Financial, LLC | 0 | -100,00 | 0 | |||||
| 2025-08-14 | 13F | Federation des caisses Desjardins du Quebec | 3.000 | 0,00 | 332 | 7,44 | ||||
| 2025-08-14 | 13F | Royal Bank Of Canada | 18.226 | 1,23 | 2.019 | 8,84 | ||||
| 2025-05-01 | 13F | Northwest Capital Management Inc | 0 | -100,00 | 0 | |||||
| 2025-08-08 | 13F | Cetera Investment Advisers | 2.741 | 6,24 | 304 | 14,34 | ||||
| 2025-08-11 | 13F | Citigroup Inc | 3.614 | -0,55 | 401 | 6,95 | ||||
| 2025-08-08 | 13F | Family Firm, Inc. | 0 | -100,00 | 0 | |||||
| 2025-08-14 | 13F | Mml Investors Services, Llc | 5.762 | -0,95 | 1 | |||||
| 2025-07-29 | 13F | JTC Employer Solutions Trusteee Ltd | 4.700 | 0,00 | 1 | |||||
| 2025-07-30 | 13F | D.a. Davidson & Co. | 2.516 | -21,64 | 279 | -15,76 | ||||
| 2025-07-28 | 13F | Rosenberg Matthew Hamilton | 2 | 0,00 | 0 | |||||
| 2025-08-11 | 13F | Principal Securities, Inc. | 73 | 8,96 | 8 | 33,33 | ||||
| 2025-08-12 | 13F | LPL Financial LLC | 35.027 | 13,95 | 3.882 | 22,58 | ||||
| 2025-07-31 | 13F | Optimum Investment Advisors | 0 | -100,00 | 0 | |||||
| 2025-08-06 | 13F | Kcm Investment Advisors Llc | 5.576 | 618 | ||||||
| 2025-08-14 | 13F | Citadel Advisors Llc | 43.735 | 99,62 | 4.847 | 114,71 | ||||
| 2025-07-22 | 13F | Sava Infond d.o.o. | 400 | 0,00 | 44 | 7,32 | ||||
| 2025-07-02 | 13F | Central Pacific Bank - Trust Division | 42 | 0,00 | 5 | 0,00 | ||||
| 2025-07-31 | 13F | Cambridge Investment Research Advisors, Inc. | 3.514 | -9,69 | 0 | |||||
| 2025-08-13 | 13F/A | StoneX Group Inc. | 4.044 | -23,78 | 321 | -24,29 | ||||
| 2025-07-29 | 13F | Salomon & Ludwin, LLC | 50.546 | -5,59 | 5.620 | 1,90 | ||||
| 2025-08-14 | 13F | Mercer Global Advisors Inc /adv | 2.141 | 237 | ||||||
| 2025-08-15 | 13F | Tower Research Capital LLC (TRC) | 1 | 0,00 | 0 | |||||
| 2025-08-14 | 13F | Arete Wealth Advisors, LLC | 0 | -100,00 | 0 | |||||
| 2025-07-28 | 13F | BRYN MAWR TRUST Co | 256 | -13,80 | 28 | -6,67 | ||||
| 2025-07-11 | 13F | Farther Finance Advisors, LLC | 1.055 | 103,67 | 117 | 118,87 | ||||
| 2025-07-31 | 13F | FSM Wealth Advisors, LLC | 4.075 | 453 | ||||||
| 2025-07-30 | 13F | Cookson Peirce & Co Inc | 4.122 | -4,03 | 457 | 3,17 | ||||
| 2025-08-11 | 13F | TD Waterhouse Canada Inc. | 291 | 0,00 | 32 | 10,34 | ||||
| 2025-08-01 | 13F | Banco Santander, S.A. | 56.968 | 3,17 | 6.313 | 10,99 | ||||
| 2025-08-14 | 13F | McIlrath & Eck, LLC | 2.425 | -6,30 | 269 | 0,75 | ||||
| 2025-04-21 | 13F | Ayalon Holdings Ltd. | 0 | -100,00 | 0 | |||||
| 2025-08-04 | 13F | Mesirow Financial Investment Management, Inc. | 2.775 | 0,00 | 308 | 7,72 | ||||
| 2025-08-06 | 13F | Atlantic Union Bankshares Corp | 403 | 45 | ||||||
| 2025-08-11 | 13F | HighTower Advisors, LLC | 8.094 | 0,65 | 897 | 8,21 | ||||
| 2025-08-04 | 13F | Assetmark, Inc | 210 | 14,13 | 23 | 27,78 | ||||
| 2025-08-14 | 13F | Warren Averett Asset Management, LLC | 2.327 | 0,00 | 258 | 7,53 | ||||
| 2025-08-13 | 13F | Northwestern Mutual Wealth Management Co | 3.858 | 10,17 | 428 | 18,61 | ||||
| 2025-08-14 | 13F | Jane Street Group, Llc | 16.464 | -50,43 | 1.825 | -46,68 | ||||
| 2025-08-14 | 13F | Raymond James Financial Inc | 10.757 | 54,60 | 1.192 | 66,48 | ||||
| 2025-08-05 | 13F | Strategic Financial Concepts, LLC | 2.200 | 0,00 | 244 | 7,52 | ||||
| 2025-07-31 | 13F | City State Bank | 1.425 | 16,33 | 158 | 24,60 | ||||
| 2025-08-14 | 13F | GWM Advisors LLC | 656 | 0,31 | 73 | 7,46 |